Dataset

Summary for Policymakers of the IPCC Special Report: Global Warming of 1.5°C - data for Figure SPM.1 (v20200602)
Abstract
Data for Figure SPM.1 from the Summary for Policymakers (SPM) of the Intergovernmental Panel on Climate Change (IPCC) Special Report on Global Warming of 1.5°C.
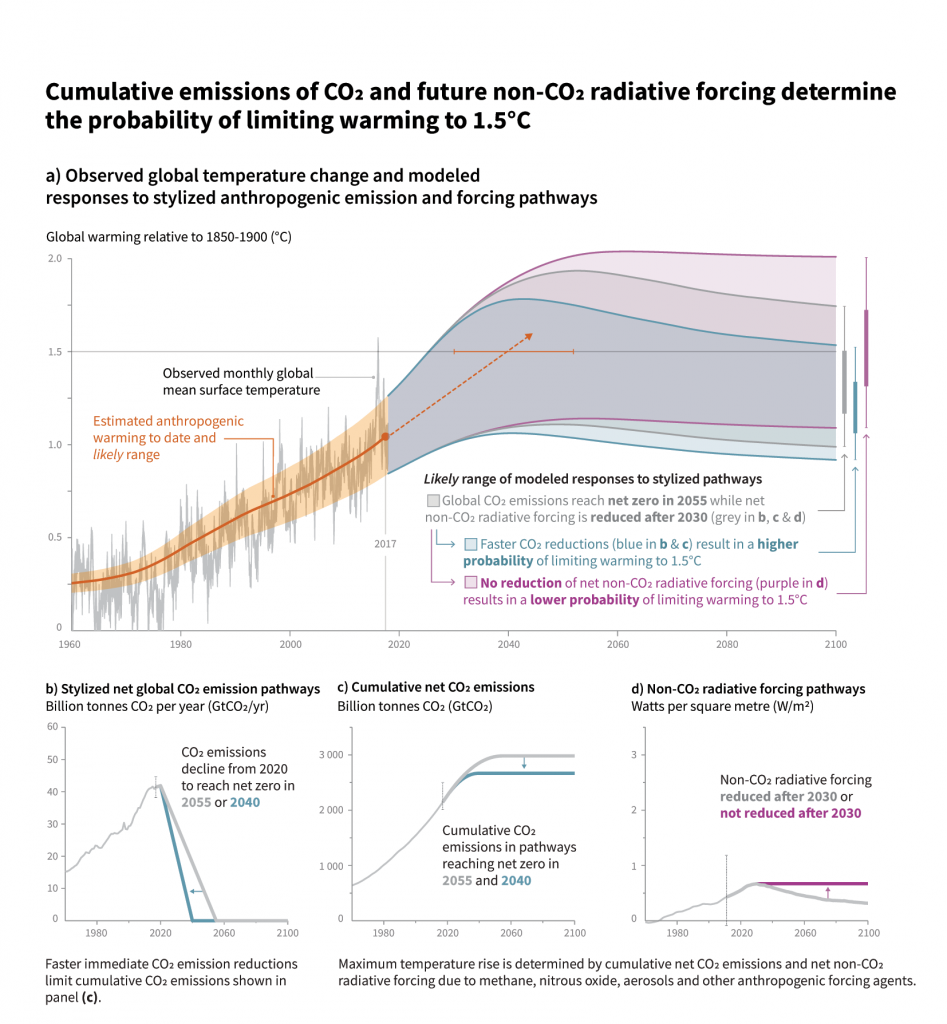
Figure SPM.1 relates global mean surface temperature to cumulative emissions of CO2 and visualises the probability of limiting global warming to 1.5°C.
---------------------------------------------------
How to cite this dataset
---------------------------------------------------
When citing this dataset, please include both the data citation below and the following citation for the report component from which the figure originates:
IPCC, 2021: Summary for Policymakers. In: Climate Change 2021: The Physical Science Basis. Contribution of Working Group I to the Sixth Assessment Report of the Intergovernmental Panel on Climate Change [Masson-Delmotte, V., P. Zhai, A. Pirani, S.L. Connors, C. Péan, S. Berger, N. Caud, Y. Chen, L. Goldfarb, M.I. Gomis, M. Huang, K. Leitzell, E. Lonnoy, J.B.R. Matthews, T.K. Maycock, T. Waterfield, O. Yelekçi, R. Yu, and B. Zhou (eds.)]. Cambridge University Press, Cambridge, United Kingdom and New York, NY, USA, pp. 3−32, doi:10.1017/9781009157896.001.
---------------------------------------------------
Sources of additional information
---------------------------------------------------
Links to Figure SPM.1 in the IPCC Special Report on Global Warming of 1.5°C, an interactive version of the figure, and supporting information in the Supplementary Material for Chapter 1 (Section 1.SM.6) can be found in the Related Documents section of this catalogue record.
---------------------------------------------------
Figure subpanels
---------------------------------------------------
The figure has four panels, with data provided for panels (a), (b) and (d) in subdirectories named panel_a, panel_b and panel_d. Panel (c) data can be computed from panel (b) data so are not provided here.
---------------------------------------------------
List of data provided
---------------------------------------------------
The dataset contains global time-series data from 1960-2100 for:
- Observed global temperature change (1960-2017).
- Historical anthropogenic global warming (1960-2017).
- Modelled warming responses to global emission and radiative forcing pathways (2018-2100).
The dataset also contains global time-series data for carbon dioxide (CO2) and non-CO2 radiative forcing from 1960-2100 for:
- Historical global net CO2 emissions (1960-2017).
- Stylized global net CO2 emission pathways (2018-2100).
- Historical global cumulative net CO2 emissions (1960-2017).
- Stylized global cumulative net CO2 emission pathways (1960-2100).
- Historical global non-CO2 radiative forcing pathways (1960-2017).
- Global non-CO2 radiative forcing pathways (2018-2100).
---------------------------------------------------
Data provided in relation to figure
---------------------------------------------------
Panel a:
- Data file: panel_a/temps_hist.csv (monthly data, 1850-2017); relates to the left part showing observed global mean surface temperature change (grey line) and estimated anthropogenic global warming (orange line with shading the assessed likely range).
- Data files: panel_a/temps_blue.csv, panel_a/temps_grey.csv, panel_a/temps_purple.csv (yearly data, 2018-2100, the lower and upper bound variables are plotted). These relate to the right part showing the likely range of warming responses (grey, blue and purple plumes) for different combinations of global net CO2 emission and net non-CO2 radiative forcing pathways.
Panel b:
- Data file: panel_b/gcp_out.csv (yearly data, 1960-2017); relates to the left part showing historical global net CO2 emissions (grey line).
- Data file: panel_b/CO2_ems.csv (yearly data, 2018-2100, values in GtC rather than GtCO2); relates to the right part showing two stylized future global net CO2 emission pathways (grey land blue lines).
Panel d:
- Data file: panel_d/nonCO2_RF.csv (yearly data, 1960-2017, variable nonCO2RF_grey is plotted); relates to the left part showing historical global net non-CO2 radiative forcing.
- Data file: panel_d/nonCO2_RF.csv (yearly data, 2018-2100, variables nonCO2RF_grey and nonCO2RF_purple are plotted); relates to the right part showing two stylized future global net non-CO2 radiative forcing pathways (grey and purple lines).
Details
| Previous Info: |
2025-12-09 This dataset is temporarily unavailable for download from the CEDA archive. We are working on restoring access. Please see our … Show More 2025-12-09 This dataset is temporarily unavailable for download from the CEDA archive. We are working on restoring access. Please see our latest news items for updates. - if you require access to this data in the meantime then please contact the CEDA helpdesk. Show Less |
|---|---|
| Previously used record identifiers: |
No related previous identifiers.
|
| Access rules: |
Public data: access to these data is available to both registered and non-registered users.
Use of these data is covered by the following licence(s): https://artefacts.ceda.ac.uk/licences/missing_licence.pdf When using these data you must cite them correctly using the citation given on the CEDA Data Catalogue record. |
| Data lineage: |
Data produced by Intergovernmental Panel on Climate Change (IPCC) authors and supplied for archiving at the Centre for Environmental Data Analysis (CEDA) by the Technical Support Unit (TSU) for IPCC Working Group I (WGI). |
| Data Quality: |
Data as provided by the IPCC
|
| File Format: |
badc_csv
|
Related Documents
Process overview
| Title | Caption for Figure SPM.1 from the Summary for Policymakers of the IPCC Special Report on global Warming of 1.5°C. |
| Abstract | Panel a: Observed monthly global mean surface temperature (GMST) (grey line up to 2017, from the HadCRUT4, GISTEMP, Cowtan–Way, and NOAA datasets) |
| Input Description | None |
| Output Description | None |
| Software Reference | None |
- units: GtC
- long_name: CO2_ems_blue
- units: GtC
- long_name: CO2_ems_grey
- long_name: CO2_ems_historical
- units: GtCO2
- long_name: Year
- units: Year
- units: Degrees C
- long_name: anthro_temp_lowerbound
- units: Degrees C
- long_name: anthro_temp_median
- units: Degrees C
- long_name: anthro_temp_upperbound
- units: Degrees C
- long_name: gmst_observations
- units: W/m2
- long_name: nonCO2RF_grey
- units: W/m2
- long_name: nonCO2RF_purple
- long_name: temp_grey_lowerbound
- units: Degrees C
- long_name: temp_grey_median
- units: Degrees C
- long_name: temp_grey_upperbound
- units: Degrees C
- long_name: temp_purple_lowerbound
- units: Degrees C
- long_name: temp_purple_median
- units: Degrees C
- long_name: temp_purple_upperbound
- units: Degrees C
Co-ordinate Variables
Temporal Range
1960-01-01T00:00:00
2100-12-31T23:59:59
Geographic Extent
90.0000° |
||
-180.0000° |
180.0000° |
|
-90.0000° |