Dataset
NOAA-CIRES Twentieth Century Reanalysis Project: 56 ensemble member run output for 1876-1880 in GRIB format, Version II
Abstract
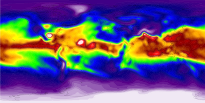
The 20th Century Reanalysis dataset provides 6 hourly analyses on a global grid from 1870 to present produced from a series of 56-member ensemble runs. These data are the from each of the 56 ensemble members from the run covering 1876 to 1880. These data were produced on a 2 degree latitude-longitude (180x91) global grid and include data both at the surface and on pressure levels.
The dataset authors request that the following acknowledgment be included in all papers using the dataset:
'Support for the Twentieth Century Reanalysis Project dataset is provided by the U.S. Department of Energy, Office of Science Innovative and Novel Computational Impact on Theory and Experiment (DOE INCITE - http://www.doeleadershipcomputing.org/incite-program/ ) program, and Office of Biological and Environmental Research (BER - http://science.energy.gov/ber/ ), and by the National Oceanic and Atmospheric Administration Climate Program Office (http://www.climate.noaa.gov/).'
Details
| Previous Info: |
No news update for this record
|
|---|---|
| Previously used record identifiers: |
http://badc.nerc.ac.uk/view/badc.nerc.ac.uk__ATOM__ACTIVITY_3cbbdbd4-1ced-11e2-80e5-00163e251233
|
| Access rules: |
Public data: access to these data is available to both registered and non-registered users.
Use of these data is covered by the following licence(s): http://creativecommons.org/licenses/by/4.0/ When using these data you must cite them correctly using the citation given on the CEDA Data Catalogue record. |
| Data lineage: |
The Twentieth Century Reanalysis data were produced by the National Centers for Atmospheric Prediction (NCEP) and archived at the U.S. Department of Energy's National Energy Research Scientific Computing Center (NERSC). The BADC obtained a complete copy of these data as archived at NERSC and have archived the data in the BADC archives splitting the data into the ensemble means with the associated spreads and the ensemble members for each of the runs making up the reanalysis dataset. |
| Data Quality: |
All data issues are reported in Compo GP,Whitaker JS, Sardeshmukh PD, Matsui N, Allan RJ, Yin X, Gleason Jr BE, Vose RS, Rutledge G, Bessemoulin P, Br¨onnimann S, Brunet M, Crouthamel RI, Grant AN, Groisman PY, Jones PD, Kruk MC, Kruger AC, Marshall GJ, Maugeri M, Mok HY, Nordli Ø, Ross TF, Trigo RM, Wang XL, Woodruff SD,Worley SJ. 2011. The Twentieth Century Reanalysis Project. Q. J. R. Meteorol. Soc. 137: 1–28. DOI:10.1002/qj.776 . Note: additional surface pressure observations were made available by the Australian Bureau of Meteorology after 1951-1955 run had been initiated. Therefore the 1946-1950 run was extended to the end of 1951 to incorporate these additional data and the data for 1951 should be taken from the 1946-1951 run. The ensemble means and spreads for 1951 from the 1951-1955 run have also been provided in the archive, but have been demarcated to allow the user to distinguish these data from the extended 1946-1951 run used in the means and spreads data.
|
| File Format: |
Data are WMO GRIB1 formatted
|
Process overview
| Title | April 2008 experimental version of the National Centers for Environmental Prediction (NCEP) Global Forecast System (GFS) deployed on Oak Ridge Leadership Computing Facility's (OLCF) 'Jaguar' system Cray XT5 supercomputer |
| Abstract | This computation involved: April 2008 experimental version of the National Centers for Environmental Prediction (NCEP) Global Forecast System (GFS) deployed on Oak Ridge Leadership Computing Facility's (OLCF) 'Jaguar' system Cray XT5 supercomputer. |
| Input Description | None |
| Output Description | None |
| Software Reference | None |
No variables found.
Temporal Range
1876-01-01T00:00:00
1880-12-31T00:00:00
Geographic Extent
90.0000° |
||
-180.0000° |
180.0000° |
|
-90.0000° |

